The real estate market in Markham had an interesting month in March. Prices dipped, but just slightly, inventory increased significantly and the average “days on market” improved nicely. Let’s take a closer look!
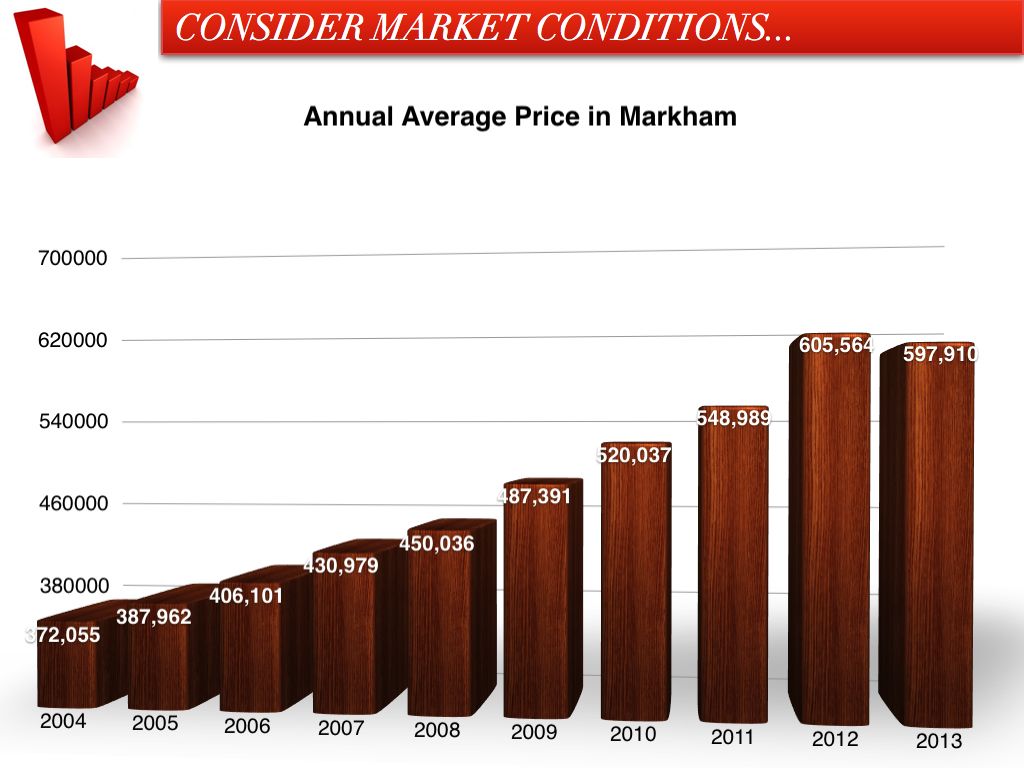
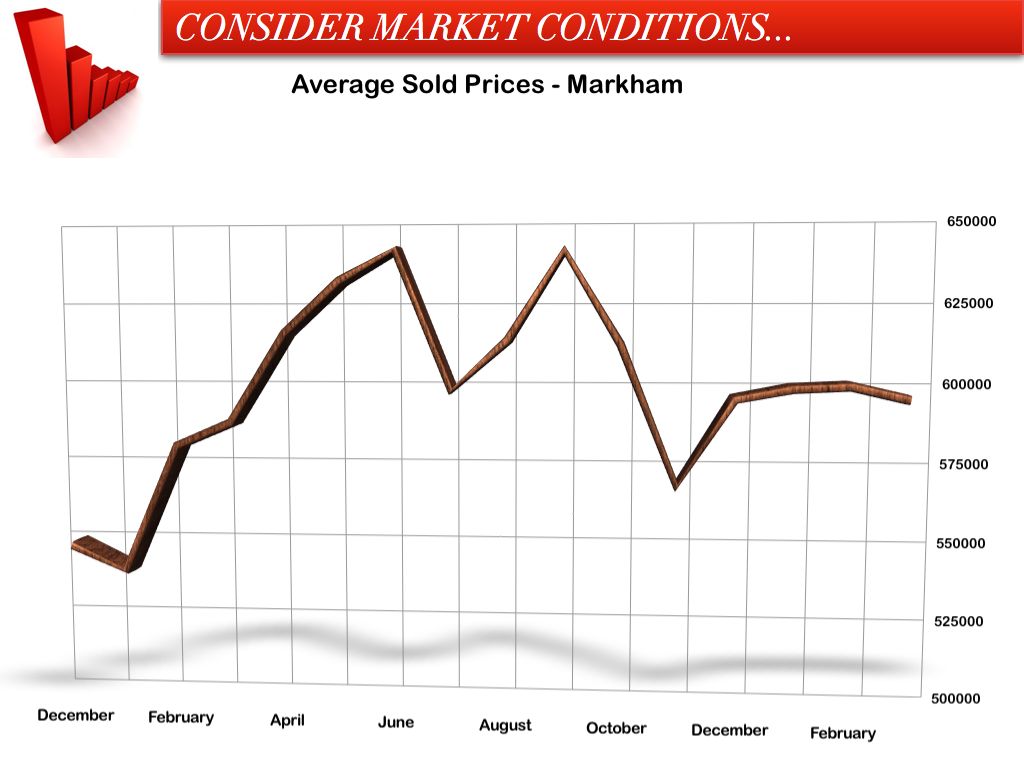
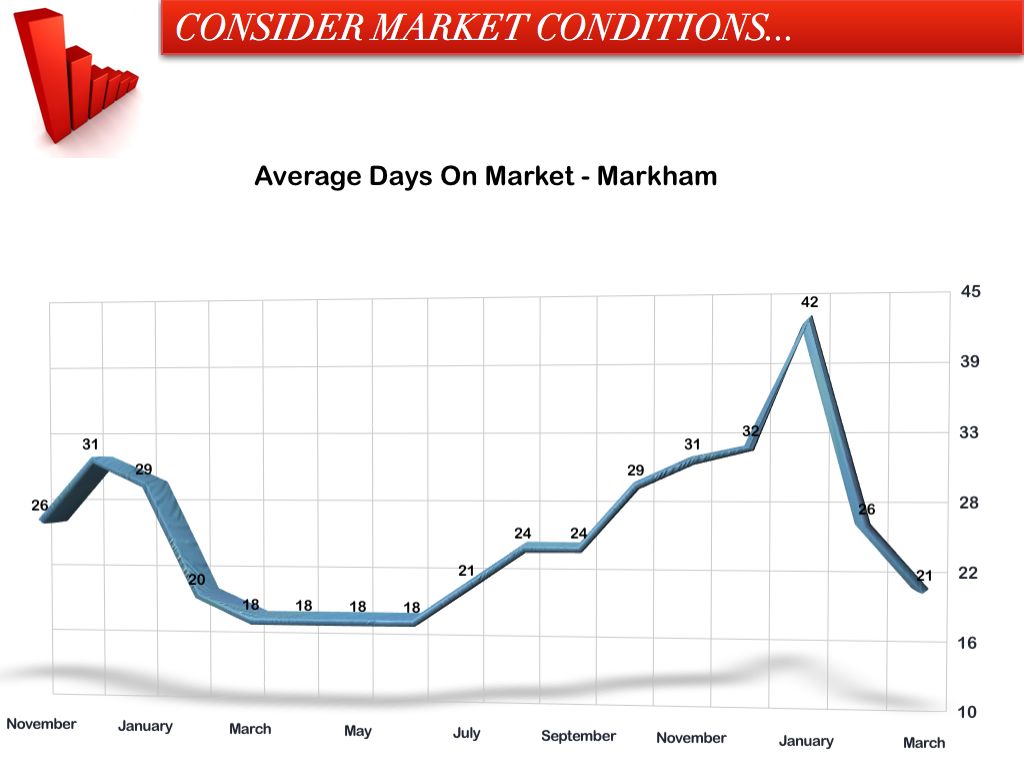
The average price of a home sold last month was $596,479; a slight drop from the $600,356 average in February. So far this year we are trending 1.26% below last year’s average but there’s a good chance we may see a small jump in the spring. The average time it took for a home to sell in March was 21 days as compared to 26 in February but still longer than the 18 days averaged in March of last year.
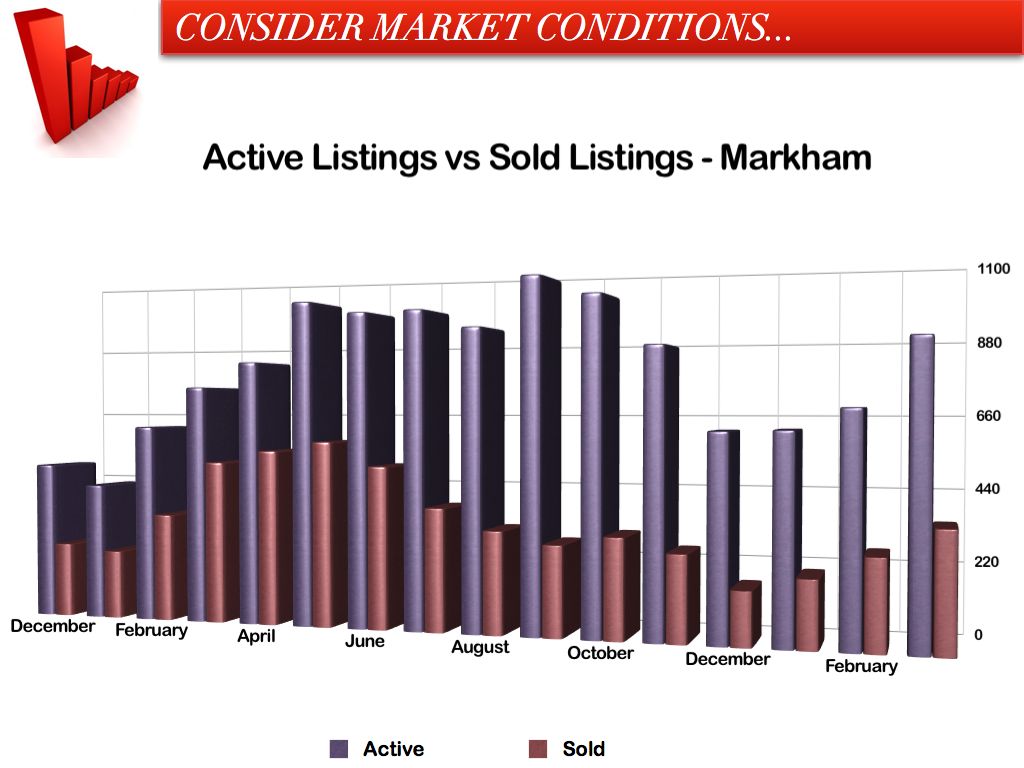
As far as total sales go, 354 homes were sold in March which is a big drop off from the 509 homes sold in the same period last year. Although definitely not the only reasons, it is worth noting that Easter weekend this year was in March as opposed to April last year and we also experienced a bit of a longer winter. As far as total inventory goes, Markham experienced a big boost from 685 homes in February to 885 homes in March which is an 18.5% increase over the amount of homes listed last March.
So what does this all mean if you’re planning to make a move right now? Well, if you’re selling, you should be aware that you’ll have a fair bit of competition right now and the market seems to be slightly favouring buyers. The sold vs active listings ratio sits at 40% which basically means that 40% of all homes listed during the month of March actually ended up selling.
While placing a proper price tag on your home and carefully preparing and staging your home is ALWAYS important, I would place extra emphasis in those areas right now.Don’t take the heated market of the last few years for granted and make sure you and your Realtor discuss a strategy that reflects the current market.
For a more visual outlook of the Markham real estate market, I’ve compiled the most recent statistics in the charts below. If you have any questions, please feel free to contact me anytime.


