Planning to buy and/or sell a home in Markham? Check out the latest sold statistics and find out how the Markham real estate is doing?
Markham Real Estate Sold Statistics During October 2014
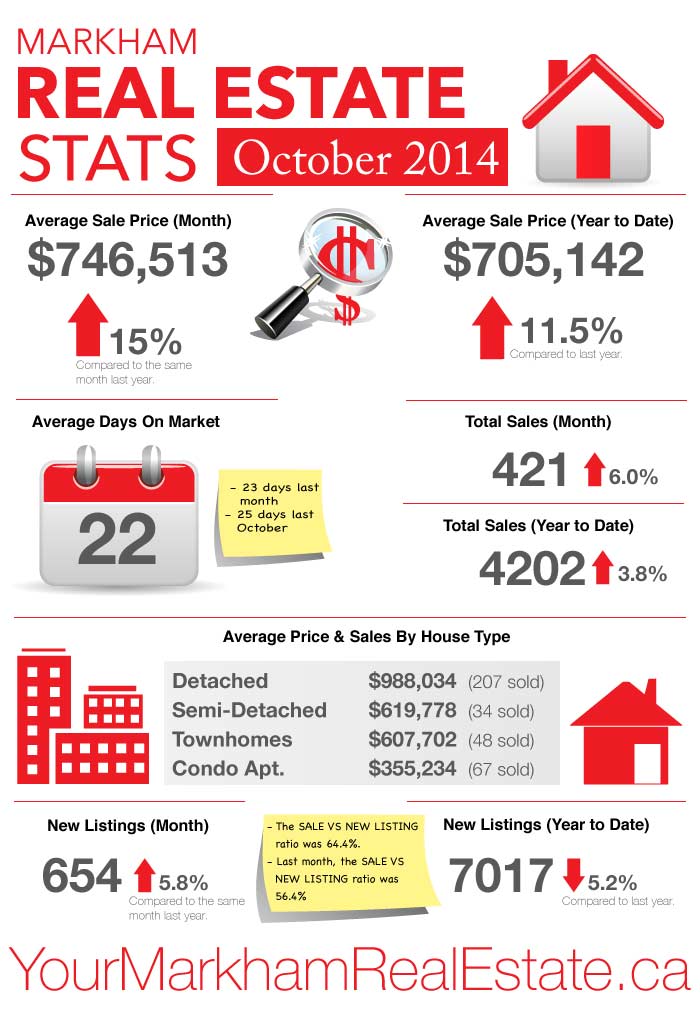
- The average sale price in October was $746,513. Up 15% over the same period last year.
- The average sale price to date this year is $705,142. Up 11.5% over the same period last year.
- The average time it took for a house to sell was 22 days compared to 23 days last month and 25 days last October.
- There were 421 total sales last month. Up 6.0% over the same period last year.
- So far this year, we have seen 4202 sales. That’s up 3.8% over the same timeframe from last year.
- There were 654 new listings last month. That’s an increase of 5.8% and a sale to new listing ratio of 64.4%
- Last month, the sale to new listing ratio was 56.4%
- So far this year, new listings are down 5.2% over the same timeframe from last year.
- The average sold price for detached homes last month was $988,034.
- The average sold price for semi-detached homes last month was $619,778.
- The average sold price for townhomes last month was $607,702.
- The average sold price for condo apartments last month was $355,234.
The current market in Markham is fairly balanced while possibly tipping towards a seller’s market. While new listings did increase in October, total inventory still remains fairly low while total sales and average prices have increased. If you’re planning to make a move in the near future and would like to discuss your situation, please contact me anytime.

Leave a Reply