2016 is off to a blazing start in the Markham area and the numbers don’t necessarily reflect it. The first half on the month was much slower than the last half of January and I can assure you that this momentum has been continuing so far in February. The buyers are out and the bidding wars have begun. Homes are selling for new records, yet again, and some pockets have been experiencing some huge price increases. If you’ve been watching the market waiting for the right time to sell….NOW is probably the best I’ve ever seen!
Check out the latest housing stats for Markham below.

Markham Real Estate Sold Statistics During January 2016
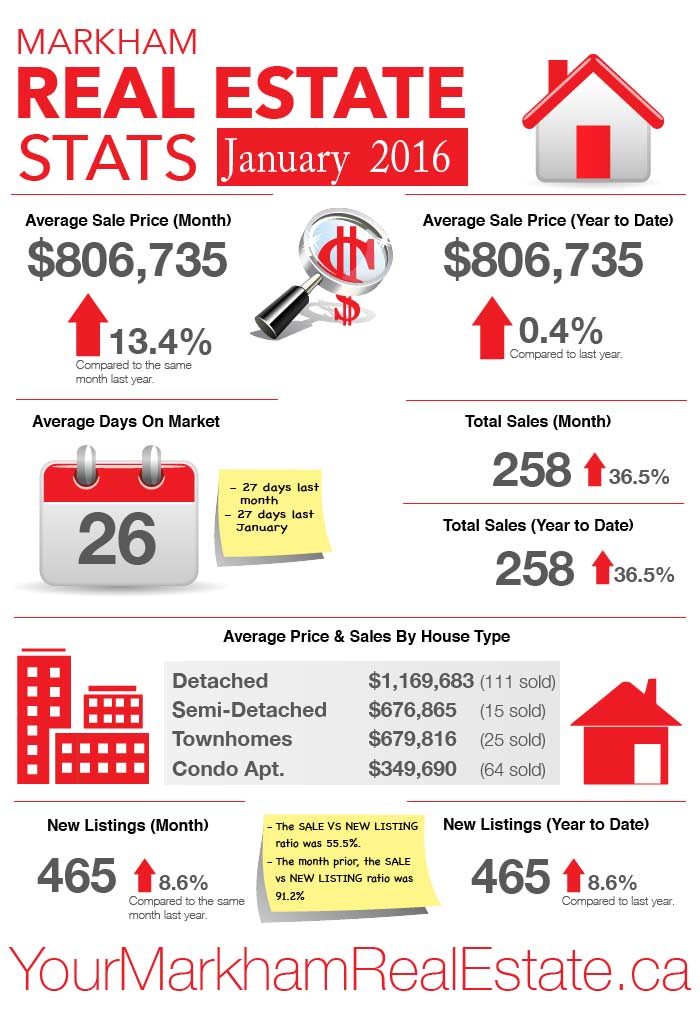
- The average sale price in January was $806,735. Up 13.4% over the same month last year.
- The average sale price to date this year is $806,735. Up 0.4% over last year.
- The average time it took for a house to sell was 26 days compared to 27 days the month prior and 27 days last January.
- There were 258 total sales last month. Up 36.5% over the same period last year.
- There were 465 new listings last month. That’s an increase of 8.6% and a sale to new listing ratio of 55.5%
- The month prior, the sale to new listing ratio was 91.2%
- The average sold price for detached homes last month was $1,169,683 with 111 homes sold.
- The average sold price for semi-detached homes last month was $676,865 with 15 homes sold.
- The average sold price for townhomes last month was $679,816 with 25 homes sold.
- The average sold price for condo apartments last month was $349,690 with 64 units sold.
If you’re planning to make a move, contact me anytime! To get a quick idea of your home’s value, please visit my online evaluation page.
Leave a Reply