The Markham real estate market had another strong month in October with respect to sales and average prices while the average days on market began to rise. Let’s take a closer look at October’s market!
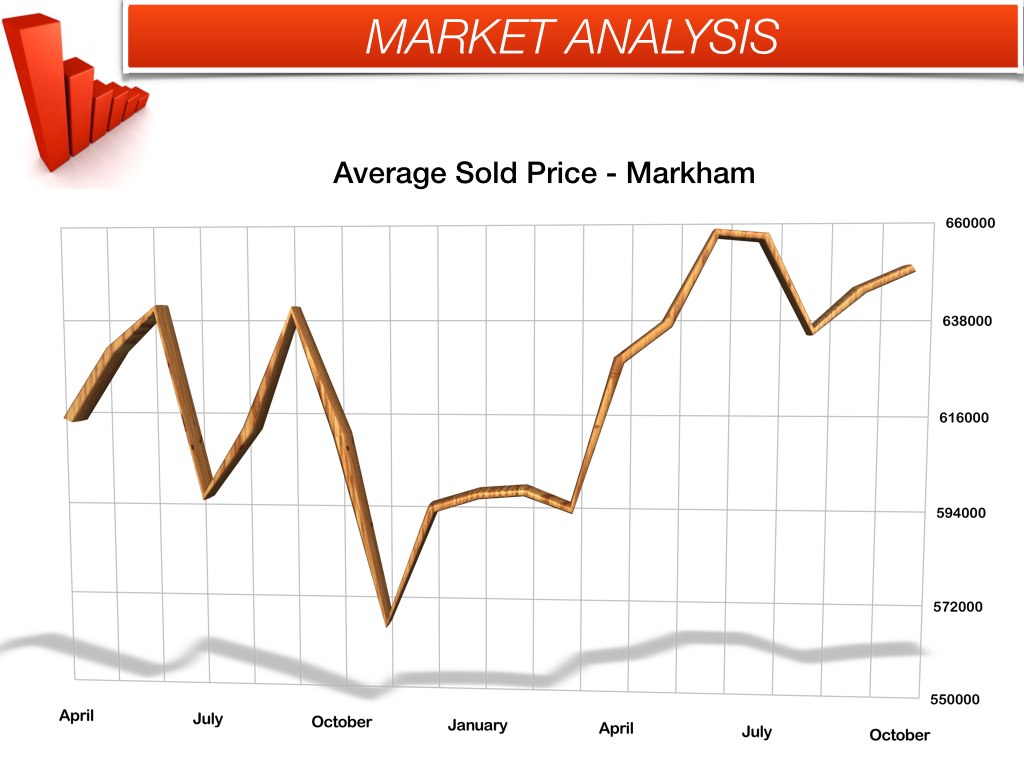
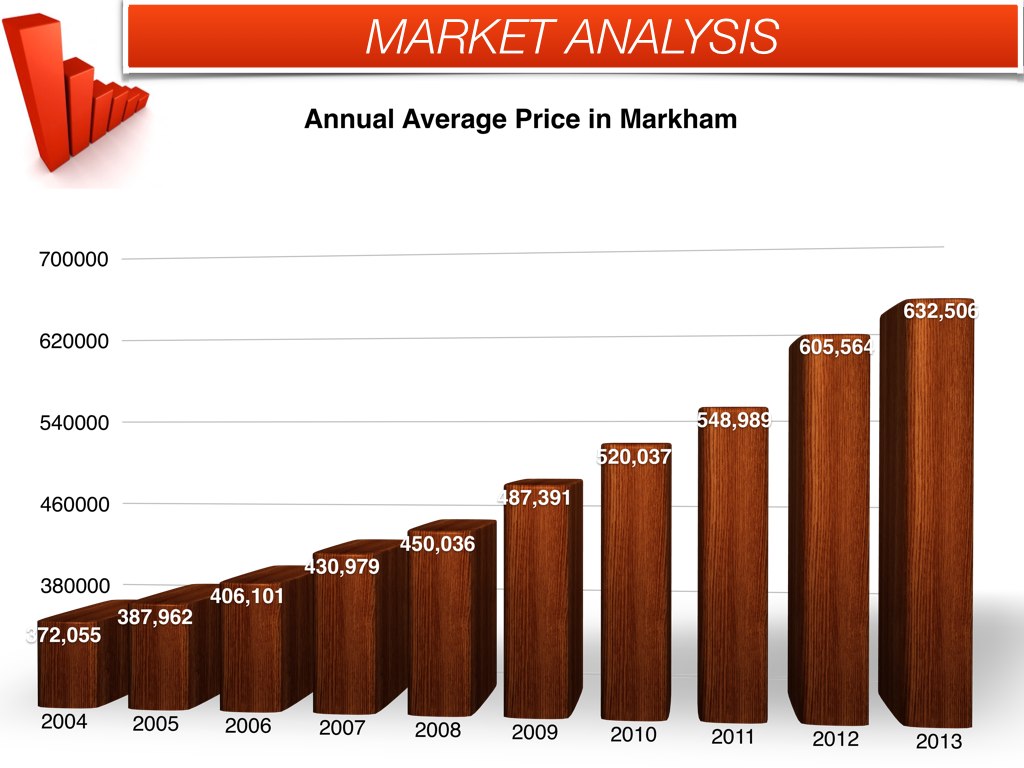
The average price during October was $649,029 which was a steady increase over the average price in September of $644,555 and a 6% increase over the same month last year. On a broader scale, the year-to-date annual average is trending at 4.5% higher than last year’s average house price. By comparison, October was a strong month in terms of price.
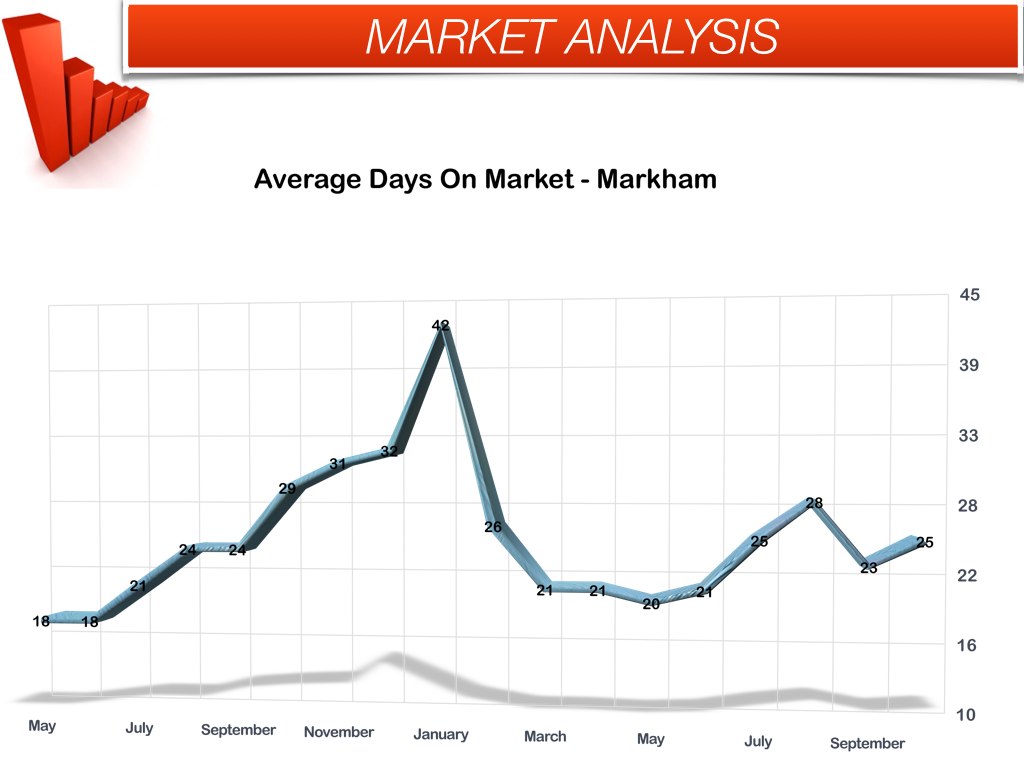
The average time it took for a home to sell in Markham during October 2013 was 25 days, up from 23 days in September. By comparison, last year in October it took the average house 29 days to sell so while we may be trending upwards, the market is still doing very well. As we head into the winter and holiday season, those numbers will likely continue to trend upwards until the new year. That doesn’t necessarily mean prices will come down, but buyers will likely have a little more time to shop around and sellers should expect the same.
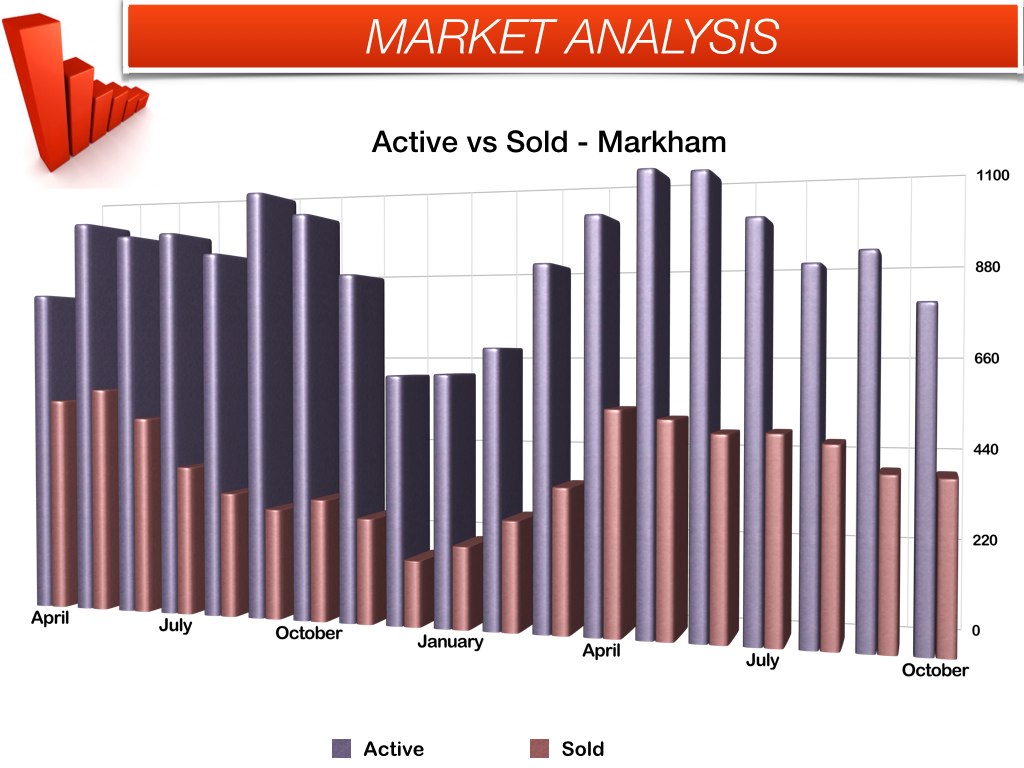
When it comes to total house sales in Markham, last month there were 397 sold listings which remained fairly steady compared to 403 sold listings in September. However, those numbers are significantly up compared to October of 2012 when only 306 houses were sold in Markham. That’s almost a 30% increase! In terms of inventory or total available MLS listings, there has been much less to choose from. In October there was 785 active listings vs 902 listings in September and 1019 available listings in October of last year.
House Prices in Markham During October 2013
| Property Type | Active | Sales | Avg $ | Med $ | Min $ | Max $ | |
|---|---|---|---|---|---|---|---|
| Att/Row/Townhouse | 81 | 39 495 |
$530,956 $503,714 |
$493,000 $483,000 |
$390,200 $365,000 |
$860,000 $945,000 |
Month Year |
| Co-op Apt | 0 | 0 0 |
– – |
– – |
– – |
– – |
Month Year |
| Condo Apt | 240 | 68 554 |
$349,390 $342,317 |
$309,000 $309,691 |
$236,000 $180,000 |
$1,800,000 $1,920,000 |
Month Year |
| Condo Townhouse | 54 | 35 304 |
$422,726 $412,407 |
$412,600 $405,000 |
$222,000 $180,000 |
$676,800 $682,000 |
Month Year |
| Detached Condo | 0 | 0 3 |
– $664,667 |
– $590,000 |
– $575,000 |
– $829,000 |
Month Year |
| Detached | 355 | 186 1980 |
$865,613 $815,745 |
$747,000 $743,250 |
$490,000 $315,000 |
$2,880,000 $3,880,000 |
Month Year |
| Link | 30 | 35 380 |
$540,783 $552,868 |
$543,000 $553,750 |
$395,000 $390,000 |
$699,000 $765,000 |
Month Year |
| Semi-Detached | 25 | 34 334 |
$543,291 $509,084 |
$528,500 $500,000 |
$455,000 $355,000 |
$678,000 $818,000 |
Month Year |
| Markham Total: | 785 | 397 4050 |
Month Year |
If you’re planning to sell or buy a home in Markham over the next few months, please give me a call and we can discuss an appropriate strategy for your current situation. I can always be reached directly at 416-995-5542 or by e-mail at [email protected]


