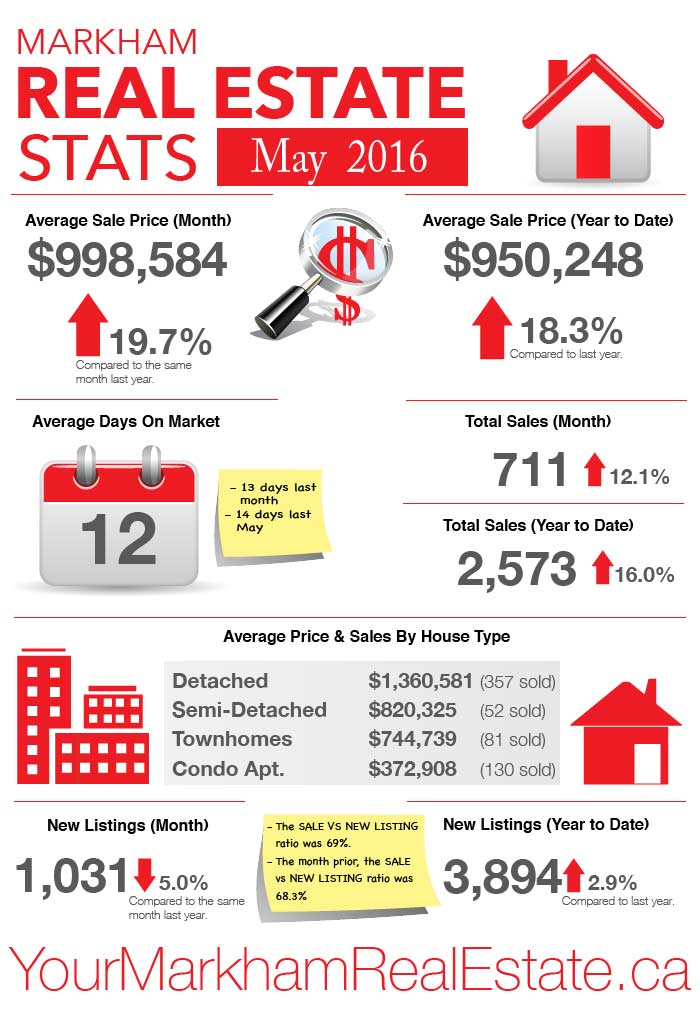
The pique of the spring market in Markham continued to surge. As compared to the month of April, prices mostly remained steady, however, when compared to the same month of 2015, home prices are up a whopping 19.7% and the average price so far this year increased to $950,248. Total inventory remains quite low and new listings last month were down by 5% so buyers have been competing over less choice.
The current market is the hottest i’ve ever seen on record and a great market to take advantage of depending on your needs. If you have any questions about how this market might affect you, please contact me anytime!
Check out the latest stats in Markham for the month of May below.

Markham Real Estate Sold Statistics During May 2016
- The average sale price in May was $998,584. Up 19.7% over the same month last year.
- The average sale price to date this year is $950,248. Up 18.3% over last year.
- The average time it took for a house to sell was 12 days compared to 13 days the month prior and 14 days last May.
- There were 711 total sales last month. Up 12.1% over the same period last year.
- So far this year, we have seen 2,573 sales. That’s up 16% over the same timeframe from last year.
- There were 1,031 new listings last month. That’s an decrease of 5% and a sale to new listing ratio of 69%
- The month prior, the sale to new listing ratio was 68.3%
- So far this year, new listings are up 2.9% over the same timeframe from last year.
- The average sold price for detached homes last month was $1,360,581 with 357 homes sold.
- The average sold price for semi-detached homes last month was $820,325 with 52 homes sold.
- The average sold price for townhomes last month was $744,739 with 81 homes sold.
- The average sold price for condo apartments last month was $372,908 with 130 units sold.
If you’re planning to make a move, contact me anytime! To get a quick idea of your home’s value, please visit my online evaluation page.
Leave a Reply