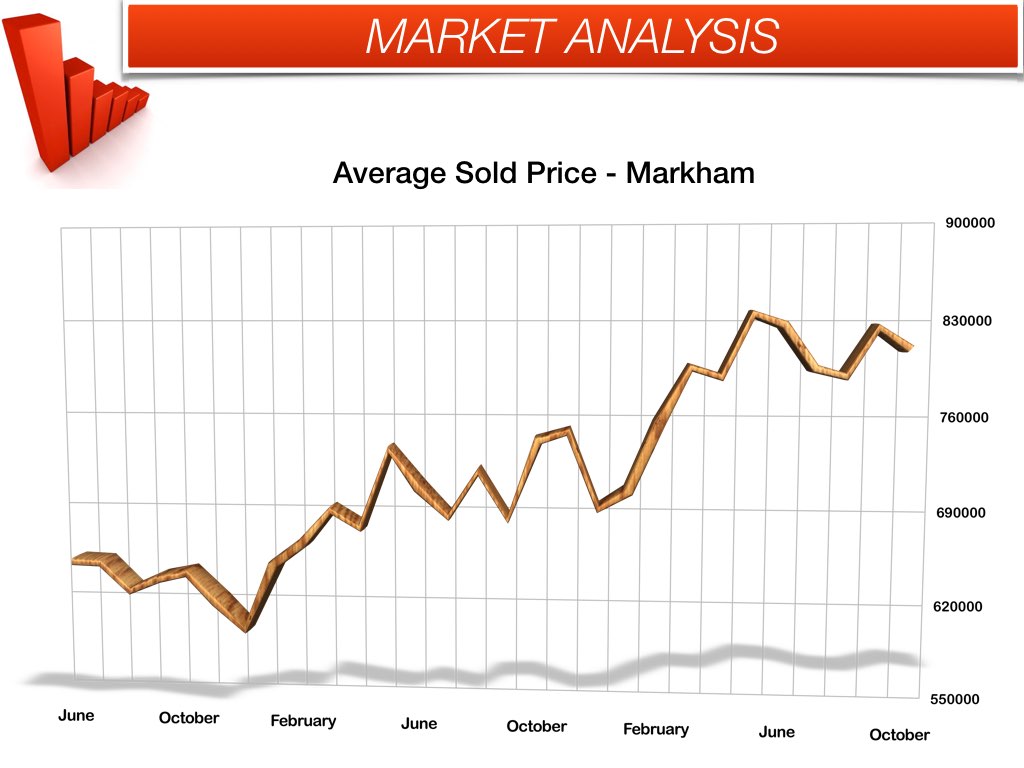
Markham house prices remain strong in October as compared to last year but the rate of growth seems to have levelled out over the past few months. While the total sales vs. new listing ratio was down significantly in September, the market seems to have picked right back up in October with a 62.9% ratio as compared to just 43.1% in September.
The announcement by the provincial government to potentially allow local municipalities to charge a 2nd land transfer tax may have helped provide this spark. Those considering a move in the near future might find themselves speeding up their timelines in order to avoid the extra tax.
Check out the latest real estate statistics for Markham below.
Markham Real Estate Sold Statistics During October 2015
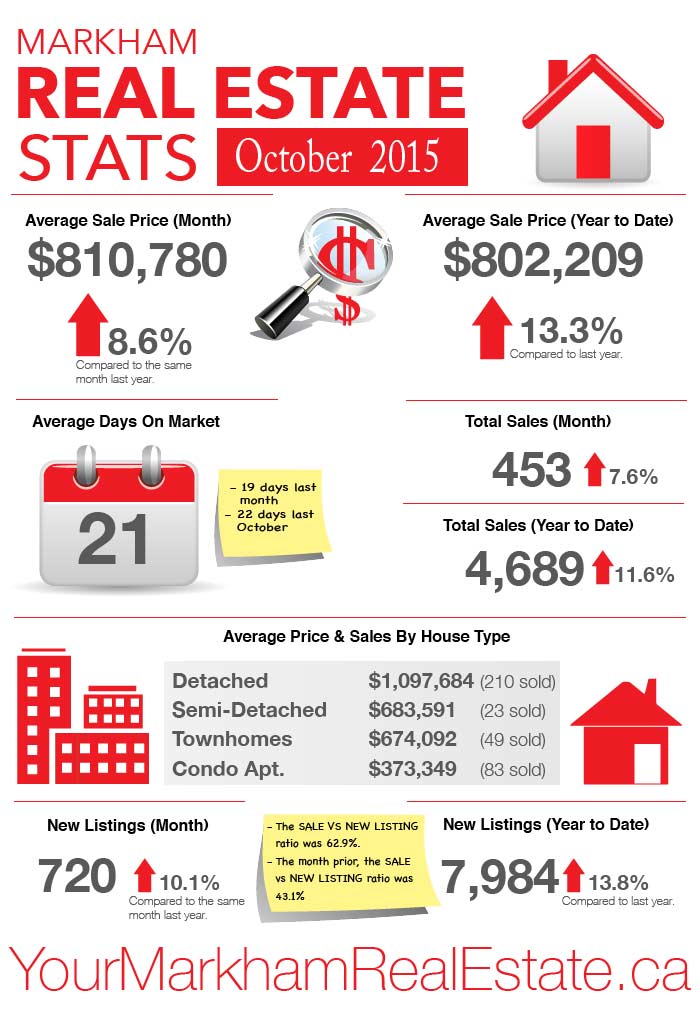
- The average sale price in October was $810,780. Up 8.6% over the same month last year.
- The average sale price to date this year is $802,209. Up 13.3% over last year.
- The average time it took for a house to sell was 21 days compared to 19 days the month prior and 22 days last October.
- There were 453 total sales last month. Up 7.6% over the same period last year.
- So far this year, we have seen 4689 sales. That’s up 11.6% over the same timeframe from last year.
- There were 720 new listings last month. That’s an increase of 10.1% and a sale to new listing ratio of 62.9%
- The month prior, the sale to new listing ratio was 43.1%
- So far this year, new listings are up 13.8% over the same timeframe from last year.
- The average sold price for detached homes last month was $1,097,684 with 210 homes sold.
- The average sold price for semi-detached homes last month was $683,591 with 23 homes sold.
- The average sold price for townhomes last month was $674,092 with 49 homes sold.
- The average sold price for condo apartments last month was $373,349 with 83 units sold.
If you’re planning to make a move, contact me anytime! To get a quick idea of your home’s value, please visit my online evaluation page.


Leave a Reply