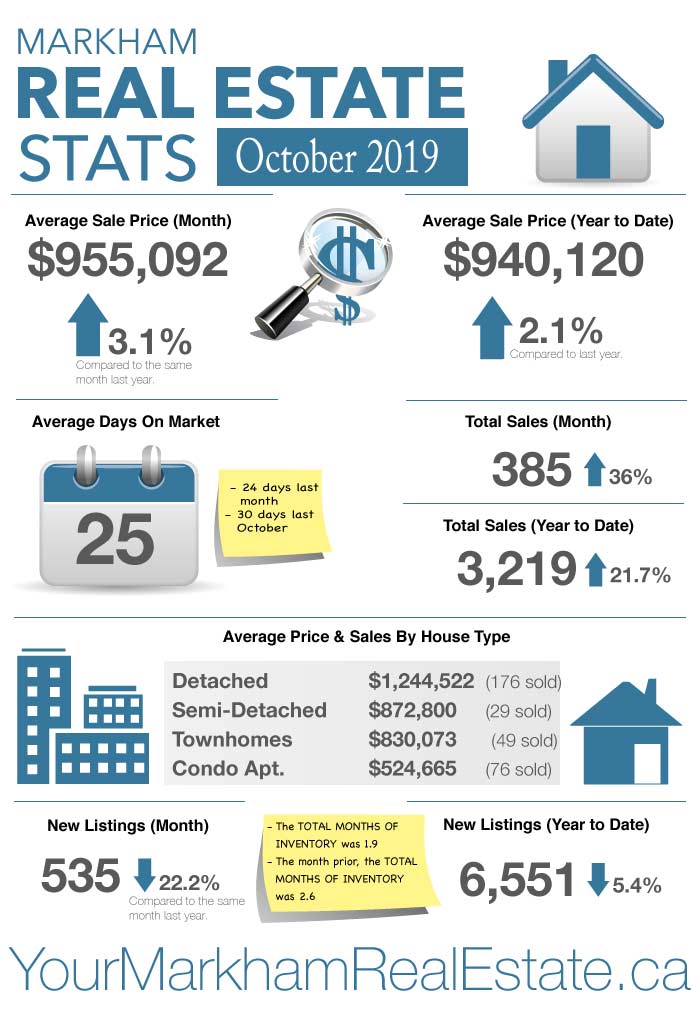
The annual trend of tightening market conditions continued in October as the total sales continued to increase and available listings continued to decrease as compared to 2018.
Total sales in October were up by 36% compared to October 2018 and so far this year, total sales are up by nearly 22%. By contrast, new listing were down by 22% compared to October of 2018 and trending downward by 5.4% on a year-to-date basis.
This has lead to a modest but continual price growth with prices up 3.1% compared to October of 2018 and an increase of 2.1% so far this year. While the market is not on fire by any means, we are certainly experiencing a healthy positive market with a good balance of available homes vs sales.

Markham Real Estate Sold Statistics During October 2019
- The average sale price in October 2019 was $1,005,148. Up 12% over the same month last year.
- The average sale price to date this year is $938,002. Up 2% over last year.
- The average time it took for a house to sell was 24 days compared to 27 days the month prior and 29 days last October.
- There were 345 total sales last month. Up 39.7% over the same period last year.
- There were 753 new listings last month. That’s a decrease of 0.5%.
- The total months of inventory was 2.6 compared to 3.4 the month prior.
- The average sold price for detached homes last month was $1,244,522 with 176 homes sold.
- The average sold price for semi-detached homes last month was $872,800 with 29 homes sold.
- The average sold price for townhomes last month was $830,073 with 49 homes sold.
- The average sold price for condo apartments last month was $524,665 with 76 units sold.
If you’re planning to make a move, contact me anytime!
To get a quick idea of your home’s value, please visit my online evaluation page and if you would like to create a customized market report, including sales of recent homes in your neighbourhood, create a customized neighbourhood market report.
Leave a Reply