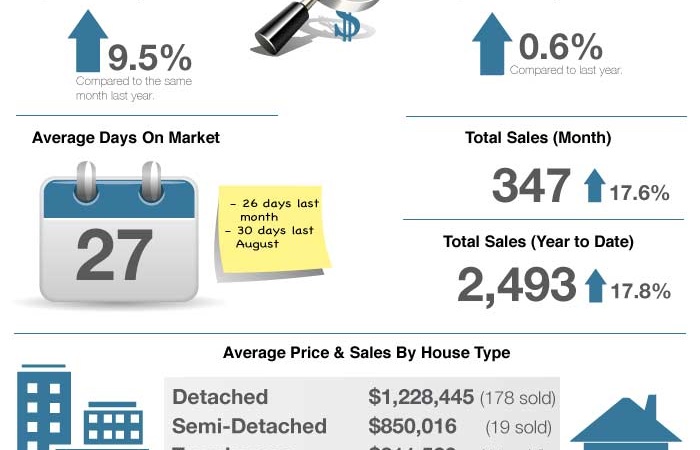
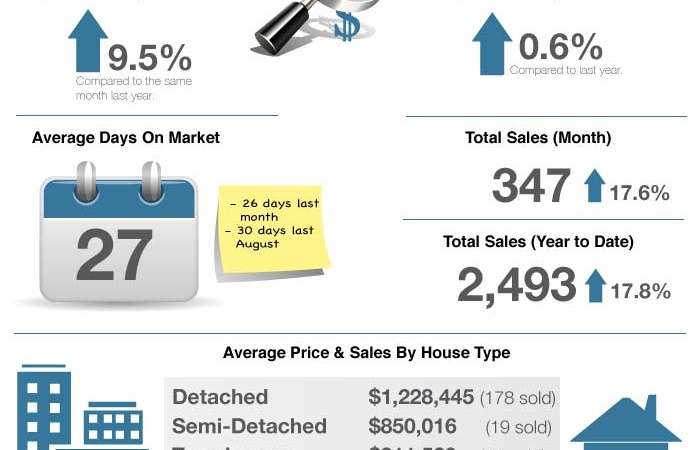
Markham Real Estate Sold Statistics During July 2019 The average sale price in July 2019 was $949,859. Up 4% over the same month last year.The average sale price to date this year is $923,891. Down 0.7% over last year.The average time it took for a house to sell was 26 days compared to 23 days ... » Learn More about July 2019 Markham Real Estate Update
Markham Market Updates
June 2019 Market Update
Markham Real Estate Sold Statistics During June 2019 The average sale price in June 2019 was $914,776. Down 6.1% over the same month last year.The average sale price to date this year is $917,693. Down 1.8% over last year.The average time it took for a house to sell was 23 days compared to 22 ... » Learn More about June 2019 Market Update
Markham Market On The Rise?
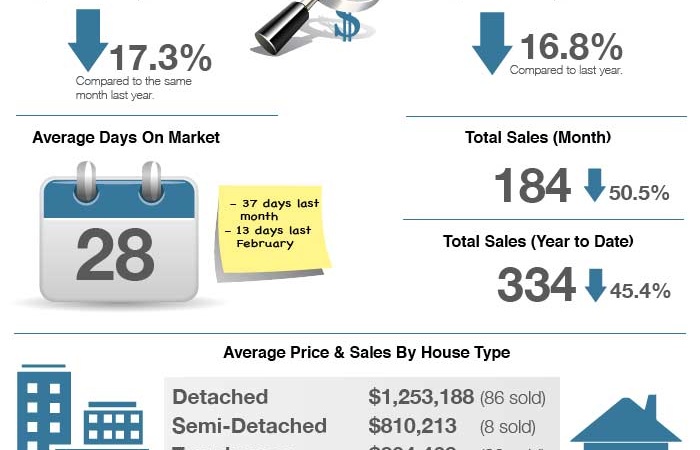
The real estate market in Markham is not on fire, that's for sure. But how bad is it? If you compare February's numbers to the same month in 2017, you'll notice huge discrepancies. The average price was down 17%, total sales were down over 50% and the average days it took to sell a home was more ... » Learn More about Markham Market On The Rise?
Markham Housing Market Remains Stable in September
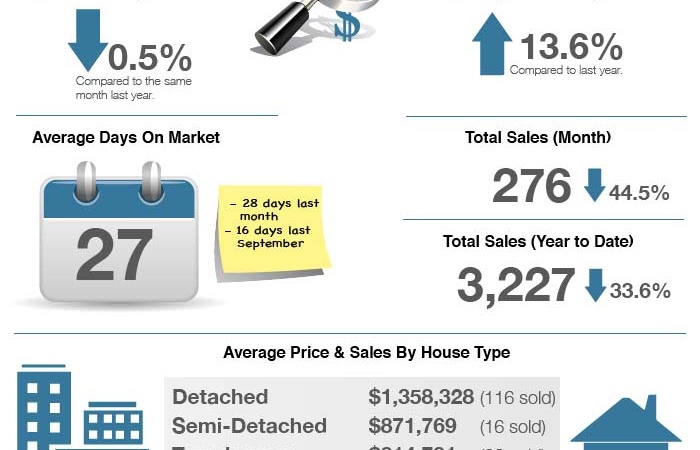
There was no major change to the real estate market in Markham in September. The average price was up just slightly but based on the few number of sales we've been seeing, this number can be a bit misleading. Prices pretty much remained the same. The total months of inventory, meaning how long it ... » Learn More about Markham Housing Market Remains Stable in September
A Great Time To Buy In Markham!
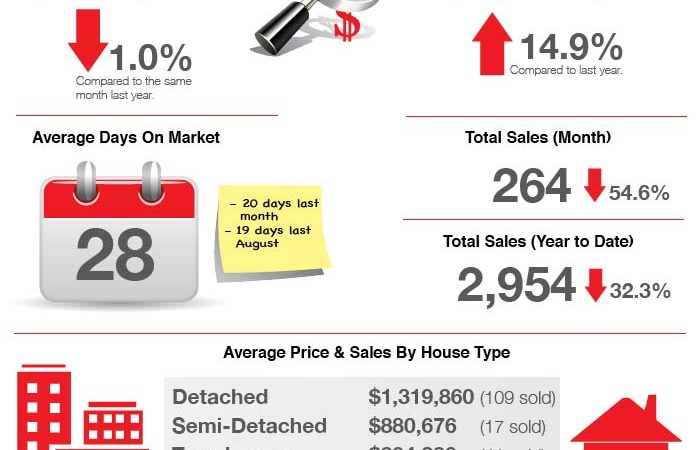
The average sale price in Markham was down by 1% compared to August of 2016 but year-to-date, we are trending at nearly 15% higher. The average time it took for a home to sell in August was up to 28 days as compared to 20 days in July and only 19 days last August. The sale to new listings ratio ... » Learn More about A Great Time To Buy In Markham!
