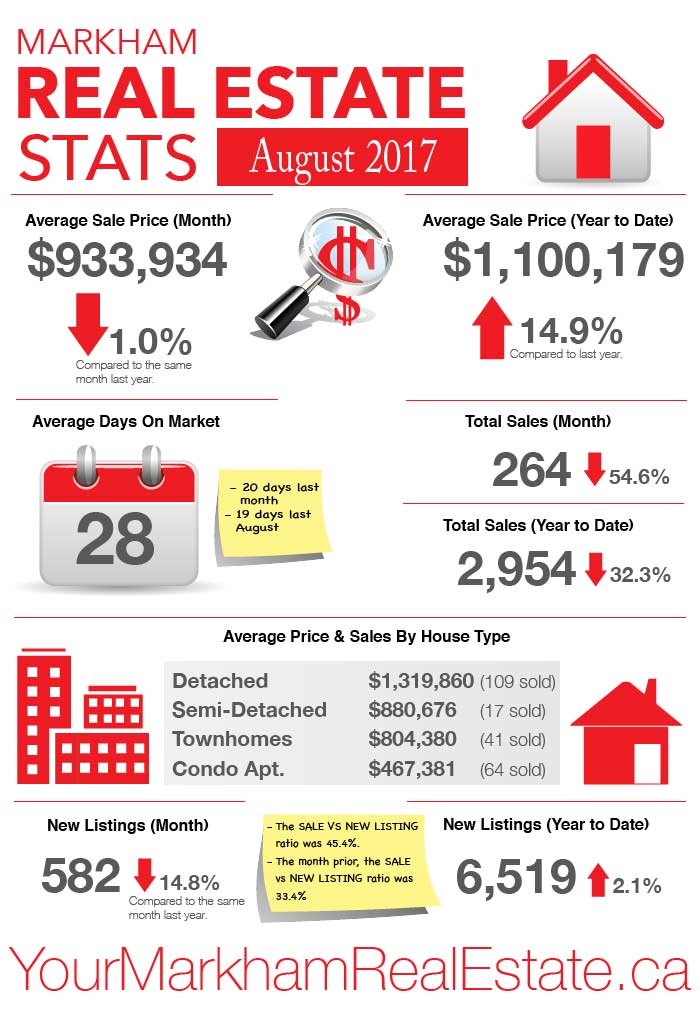
The average sale price in Markham was down by 1% compared to August of 2016 but year-to-date, we are trending at nearly 15% higher. The average time it took for a home to sell in August was up to 28 days as compared to 20 days in July and only 19 days last August. The sale to new listings ratio was up from 33.4% to 45.4% which could be an indicator that things may start to pick up over the coming months.
There’s a very good chance that house prices in Markham may have already reached bottom and that prices will likely begin to rebound in the coming month. From a buyer’s perspective, I don’t think I’ve seen a better time to buy in recent years as right now and I believe the next few months will be a good opportunity for first time buyers and move-up buyers to take advantage of the current conditions.
While the “Fair Housing Regulations” announced by the government had a clear effect on the market, it seems as though the downturn was a result of mostly speculation with people taking a “wait and see” approach as opposed actually having a direct impact on buyers….most notably, foreign buyers who account for only 4-5% of the market. The Canadian government has also recently announced very positive economic news with our economy outperforming expectations which will likely translate into more confidence and optimism in the marketplace.
For anybody considering buying a home in the Markham area in the near future, I would recommend getting your pre-approvals now to hold your rate and don’t wait too long. I don’t think I’ve ever said this before but there’s actually many great deals to be had right now.
Check out the latest real estate statistics for Markham from August 2017 below.

Markham Real Estate Sold Statistics During August 2017
- The average sale price in August 2017 was $933,934. Down 1.0% over the same month last year.
- The average sale price to date this year is $1,100,179. Up 14.9% over last year.
- The average time it took for a house to sell was 28 days compared to 20 days the month prior and 19 days last August.
- There were 264 total sales last month. Down 54.6% over the same period last year.
- There were 582 new listings last month. That’s an decrease of 14.8% and a sale to new listing ratio of 45.4%
- The month prior, the sale to new listing ratio was 33.4%.
- The average sold price for detached homes last month was $1,319,860 with 109 homes sold.
- The average sold price for semi-detached homes last month was $880,676 with 17 homes sold.
- The average sold price for townhomes last month was $804,380 with 41 homes sold.
- The average sold price for condo apartments last month was $467,381 with 64 units sold.
If you’re planning to make a move, contact me anytime! To get a quick idea of your home’s value, please visit my online evaluation page.
Leave a Reply